With SoFee project, at the moment I am working on feature where system can identify content of link belonging to one of wider category say technology, science, politics etc. I am exploring topic modelling, word2vec, clustering and their possible combination to ship first version of the feature.
Earlier I tried to extract certain number of topics from content of all links. I got some results but through out the mix of links these topics were not coherent. Next I tried to cluster similar articles using KMeans algorithm and then extract topics from these grouped articles. KMeans requires one input parameter from user, k, number of clusters user wants to be returned. In the application flow asking user for such an input won't be intuitive so I tried to make it hands free. I tried two approaches:
- Run KMeans algorithm with K varying from 2 to 25. I then tried to plot/observe average Silhouette score for all Ks, results I got weren't good that I could use/adopt this method.
- There are two known methods, gap statistic method and another one potentially superior method which can directly return optimum value of K for a given dataset. I tried to reproduce results from second method but results weren't convincing.
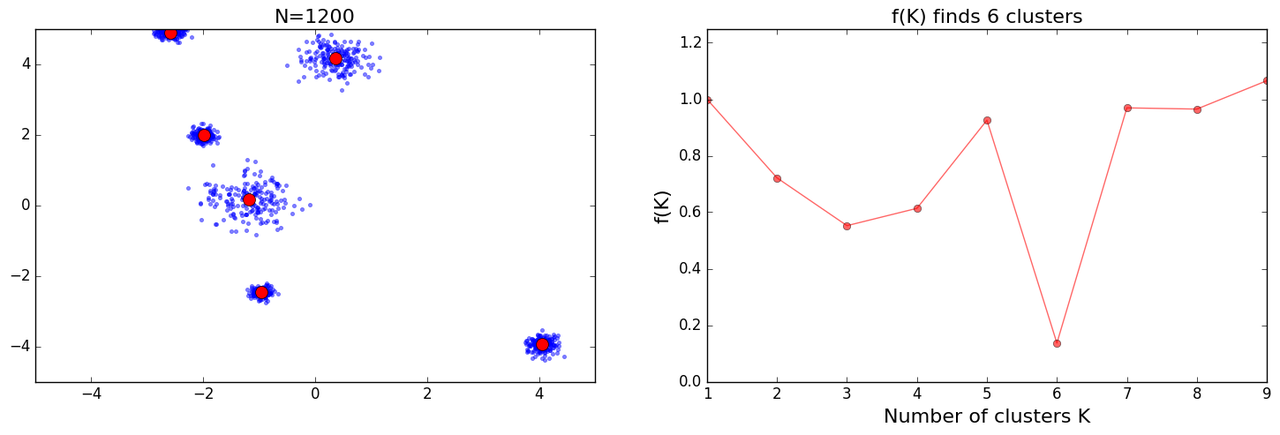
Initially I got decent results:

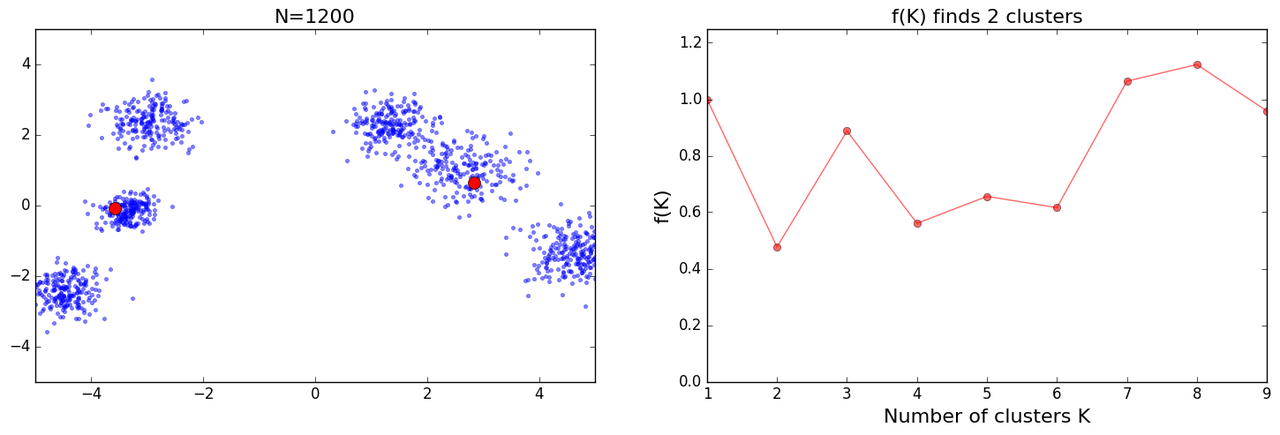
as I tried more iterations I got some mixed results:

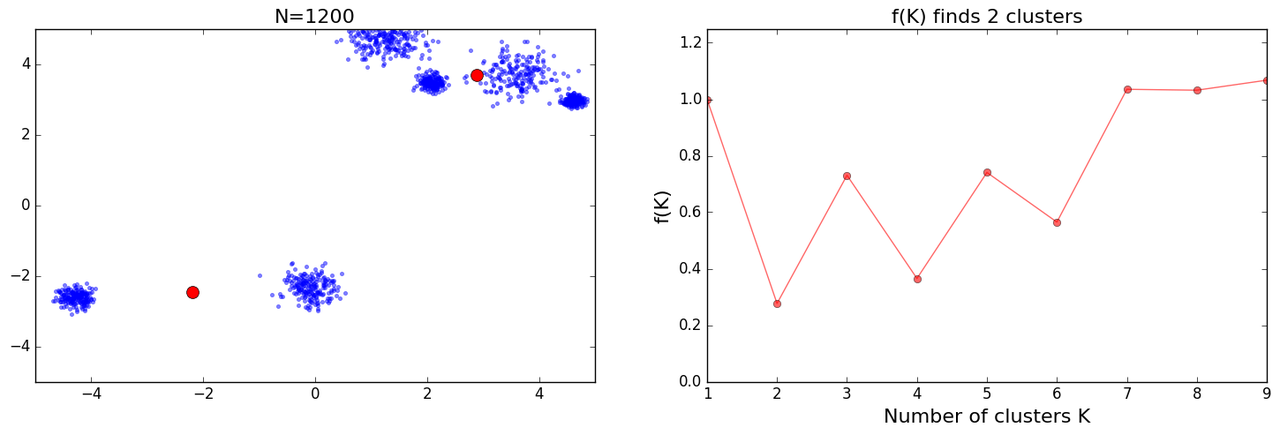
and further I got some crazy results:

Following is the code I used for these results:
# Loosely adopted from
# https://datasciencelab.wordpress.com/2014/01/21/selection-of-k-in-k-means-clustering-reloaded/
import matplotlib.pylab as plt
import numpy as np
from sklearn.cluster import KMeans
import random

def init_board_gauss(N, k):
    n = float(N)/k
    X = []
    for i in range(k):
	c = (random.uniform(-5, 5), random.uniform(-5, 5))
	s = random.uniform(0.05,0.5)
	x = []
	while len(x) < n:
	    a, b = np.array([np.random.normal(c[0], s), np.random.normal(c[1], s)])
	    # Continue drawing points from the distribution in the range [-1,1]
	    if abs(a) < 5 and abs(b) < 5:
		x.append([a,b])
	X.extend(x)
    X = np.array(X)[:N]
    return X

# This can be played around to confirm performance of f(k)
X = init_board_gauss(1200, 6)
fig = plt.figure(figsize=(18,5))
ax1 = fig.add_subplot(121)
ax1.set_xlim(-5, 5)
ax1.set_ylim(-5, 5)
ax1.plot(X[:,0], X[:, 1], '.', alpha=0.5)
tit1 = 'N=%s' % (str(len(X)))
ax1.set_title(tit1, fontsize=16)
ax2 = fig.add_subplot(122)
ax2.set_ylim(0, 1.25)
sk = 0
fs = []
centers = []
for true_k in range(1, 10):
    km = KMeans(n_clusters=true_k, init='k-means++', max_iter=100, n_init=1,
		verbose=False)
    km.fit(X)
    Nd = len(X[0])
    a = lambda k, Nd: 1 - 3/(4*Nd) if k == 2 else a(k-1, Nd) + (1-a(k-1, Nd))/6
    if true_k == 1:
	fs.append(1)
    elif sk == 0:
	fs.append(1)
    else:
	fs.append(km.inertia_/(a(true_k, Nd)*sk))
    sk = km.inertia_
    centers.append(km.cluster_centers_)

foundfK = np.where(fs == min(fs))[0][0] + 1
ax1.plot(centers[foundfK-1][:,0], centers[foundfK-1][:, 1], 'ro', markersize=10)
ax2.plot(range(1, len(fs)+1), fs, 'ro-', alpha=0.6)
ax2.set_xlabel('Number of clusters K', fontsize=16)
ax2.set_ylabel('f(K)', fontsize=16)
tit2 = 'f(K) finds %s clusters' % (foundfK)
ax2.set_title(tit2, fontsize=16)
plt.savefig('detK_N%s.png' % (str(len(X))), \
	     bbox_inches='tight', dpi=100)
plt.show()
I had many bugs in my initial version of above code and while trying to crosscheck results I kept fixing them. Eventually I read the paper and I noticed plots which were similar to mine under results section(Figs 6n to o), with further explanation which went:
However, no simple explanation could be given for the cases shown in Figs 6n and o. This highlights the fact that f(K ) should only be used to suggest a guide value for the number of clusters and the final decision as to which value to adopt has to be left at the discretion of the user.
In comments section of DataSciencelab blog someone had mentioned that we won't get this kind of results with real data. With artificial data itself if proposed solution fails I think it can hardly help me to get to appropriate k directly. Maybe what I am seeking itself is not correct, lets see what we are able to put together.